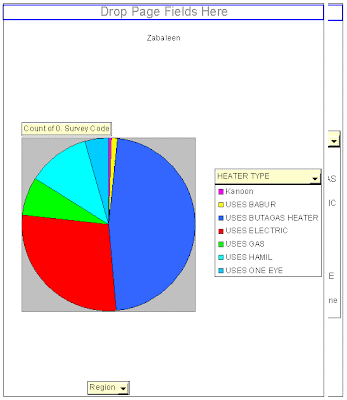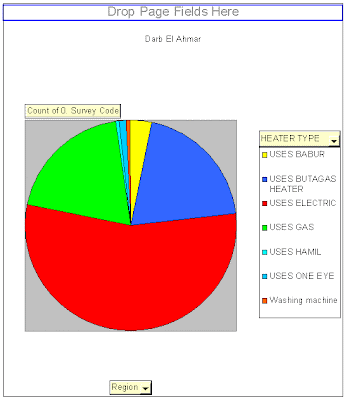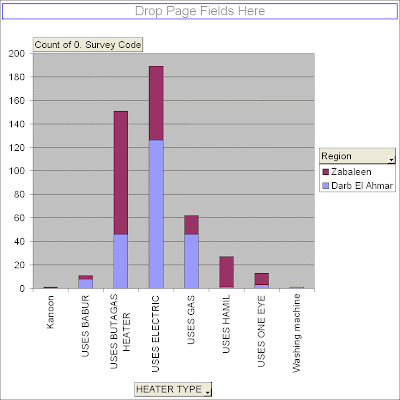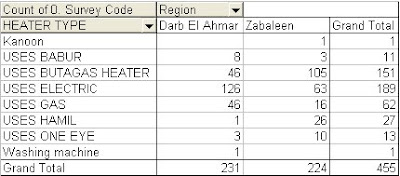

 The Pivot table from which the graphs were generated:
 The Dilemma:
Faced with a daunting amount of data, a field worker with a passion for helping communities but no particular bent for computer work can quickly get dismayed when it comes to analysing what we've been doing on the ground, especially when we learn that the student edition of SPSS only allows 50 variables and Excel worksheets only permit 256 columns. What to do?
Some suggest importing everything into a database, but that means another learning curve and an attempt to master yet another program. What to do?
The answer may turn out to be the use of Pivot Tables!
But first, a rant:
Graduate school got it all backwards! At least for those of us who want to make a career of helping the poor with sustainable development!
First you struggle through a couple of years of theory and textbook analysis and some rather useless classes in which you do a few exercises and projects in GIS, SPSS and Excel. They never mean much, though, because the data sets and case studies you are working with are truncated or often have little relation to real world problems of interest to you.
Then you take atrocious Statistics and Methodology classes that focus on arcane mathematical proofs and mind-numbing structural problems, and become so turned off to the idea of setting up a study and doing analysis that you consider abandoning the whole enterprise.
Then you write your field papers, supposedly to "ground you" in the literature, and only THEN do you head out into the real field to try to put it all together.
It sounds logical from a schoolmarms point of view (it has an anal but lexicographic beauty to it -- very neat and linear and planned, working from the small to the large) but it fails utterly when you consider the non-linear nature of human thought (no, you can't straight jacket the human mind!) and the experiential nature of human learning that most effectively occurs through play or real experience (something tangible and engaging that feels real or is real. Heck, even cats and dogs know the value of play in learning!)
No, no, no!
The way it SHOULD be done is you should be sent off to the field your first year, after a few seminar discussion classes in which you debate the intersection of your passions and the needs of the people all over the planet. You would then look to find a "best fit" by going on a series of reconaissance voyages until you see a problem you feel you can help solve.
Then you should come back and read literature and take classes from people tackling similar problems -- people with more experience but similar passion. And then you should go into the field again, and spend a few months getting a feel for real field research, gathering preliminary data and reading literature germane to the issues you are confronting WHILE YOU ARE CONFRONTING THEM. You should be able to come home from the pardoxes of the field and read stuff that frames and poses theoretical solutions to the chaos you are observing .
Then you should come back to school and write your field papers.
And then you should take your preliminary data and USE IT to struggle through learning GIS and Excel and Statistics packages so that you have visual and analytical compelling reasons to get back into the field and do a rigorous job of creating a worthy data set with a statistically significantly large data set.
Then, with the data in front of you, you should be able to link up with others around the world confronting similar problems and share ever evolving techniques and ideas for analyzing and putting it all together in reports that can be truly useful to answering the challenge of eliminating poverty (yes, it's possible) and preserving our life-support system (we CAN have both a healthy environment and a healthy economy, as President Clinton said in his last State of the Union address).
The way it is now, I have nothing but dim yet somehow still painful memories from my
statistics classes, and have to learn useful features to computer programs that I thought I once knew, have obviously forgotten and, in many cases, somehow never knew existed.
Enough whining!
The beauty of the internet is that there are so many really helpful people out there, and search engines are really really good at finding what these people have written (and posted as audio-video tutorials!) . Truth is, you don't have to go to school anymore to learn anything.
You do have to be patient though, and self-motivated. But we are getting closer and closer to creating a world in which "seek and ye shall find" is becoming possible.
A case in point is THE PIVOT TABLE.
I had never been taught about pivot tables in the classes I took where we had to use Microsoft Excel. So I had been spending inordinate precious hours searching through the 9 worskheets of my large data set, copying and pasting columns and putting them together in other worksheets so I oculd create charts and graphs that compared different columns of data. I've been doing this all week, with little to show for my efforts.
Then a package that was supposed to solve my problems arrived in the mail from the U.S. -- a student copy of SSPS that Dr. Hind Culhane (yea, my mother) bought me at Mercy College where she teaches psychology. The problem, to my chagrin, is that the student edition of SSPS limits you to 50 variables. I have over 200. It also has none of the plug-ins for doing contingent valuation or conjoint analysis. And I've forgotten how to use it.
So I set about dividing my Excel data into 50 variable worksheets and reading the SPSS manual, and it was taking forever, until I decided to get clever and Google "how do I put automatically put data from many worksheets into one", and once again found myself pointed to the excellent XL-Logic.com website. There I found I could download nifty little .xls sheets that had tutorials and examples. Several of them were on this new delight in my life: Pivot tables.
Something clicked in my mind when I saw the tutorials available on Pivot tables.
The SPSS 15.0 Guide to Data Analysis, by Marija J. Norusis says right up front (p. 18, Chapter 2) "First we'll look at a pivot table. Most of SPSS's tabular and statistical output appears in the Viewer in the form of pivot tables."
So, if pivot tables are a fundamental feature of SPSS, and they are an available feature in Excel, why not stay in the original program? After all, Excel, based on VBA scripting, is a powerful engine, so powerful in fact that some people are even using it to create 3D games! If it felt cloodgy it was because of the data table interface, not the underlying math engine. Jeff Miller, at AUC, had shown me the power of Excel for doing statistics and in his class we had even started creating a group of worksheets that could do all the statistical operations. If there was a problem it was in finding the best way to arrange the data spatially and visually so it could be worked on. SPSS seems easier than Excel to novices mainly because you do most things in Pivot Tables.
Pivot tables, if you have never used them, are tables that let you manipulate data from several columns and worksheets, apply formulas and do stats, rearrange and flip (or pivot) rows and columns (hence the term "pivot table"), create graphs and charts and reports, all without having to touch your original data. That's right, no cutting and pasting and wasting time navigating around the XY space of a dozen worksheets.
Now I know all you hard-cord Excel users know all about this, but as a field working urban planning student nobody had ever introduced me to the elegance of creating an Excel pivot table. So tonight is a revelation!
I had already prepared worksheets for importing into SPSS that were cleaned up and had the first row as header row. Now pivot tables give me some breather space to work with my data in Excel for a while longer before having to figure out how to use SPSS on them (often getting your mind to transition from one piece of software to another is enough to knock the punch out of you and spoil a day of analysis! You spend more time trying to renegotiate and navigate through this changed landscape than getting anything done -- for this reason, for example, I got a plug-in that makes The Gimp GUI look more like the Photoshop GUI so my reflexes, trained in Photoshop's screen environment, don't keep getting frustrated!)
One thing though, if you are following me down my tortured path: make sure, before you use the pivot table wizard, that the first row is your header row and that every column is filled with a header. I kept getting the following annoying message that kept me from proceeding:
"The PivotTable field name is not valid. To create a PivotTable, you must use data that is organized as a list with labeled columns. If you are changing the name of a PivotTable field, you must type a new name for the field."
I tried everything I could think of before I could think of going to Google again for help (I'm from the old school -- I keep thinking I either have to take a class in something or figure it out myself). The Microsoft Trouble shooting page that came up gave the following suggestions:
"CAUSE
This problem occurs when the first row of the range from which the PivotTable is attempting to pull data contains one or more empty cells.
THINGS TO TRY
To resolve this problem, use either of the following methods.Method 1: Remove Empty Cells
Modify the first row so that it does not contain any empty cells.Method 2: Select a Cell Range with No Empty Cells in the First Row Change the range the PivotTable references to a range where the first row does not contain empty cells. To change or determine the range of cells referenced by an existing PivotTable, follow these steps:
| 1. | Select a cell within the PivotTable. |
| 2. | On the Data menu, click PivotTable Report and Print Chart Report. |
| 3. | On the PivotTable and PivotChart Wizard - Step 3 of 3 page, click Back to display the PivotTable and PivotChart Wizard - Step 2 of 3 page. |
| 4. | The current range for the PivotTable is displayed in the Range box. If you need to modify this range, type a new range in the Range box. |
| 5. | Click Finish. |
While neither suggestion seemed to work at first, I finally figured out what the problem was: MERGED CELLS. In an attempt to make my spreadsheets easier to read I had several merged headers (so that the header would display over several cell values). Once I went through and unmerged all the cells and gave each column its own name, the pivot table wizard worked fine!


No comments:
Post a Comment